COVID-19 Modeling in New Mexico
Note: The information contained on this page is for archival purposes only and it is no longer maintained or updated.
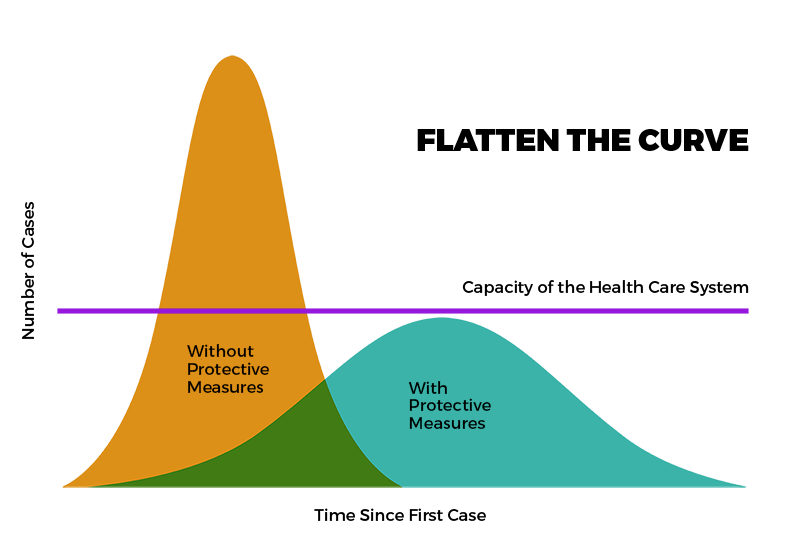
What is modeling?
During the pandemic, modeling was a powerful tool to assist health policy development and disease prevention and control. In NM, COVID-19 modeling helped in planning the State’s response to COVID-19 by attempting to predict the impact of COVID-19 on health systems and populations. Click on links below to see available historical data
About New Mexico’s COVID-19 Model
The NM COVID-19 State model is an Enhanced SIR Model, meaning it estimates the number of Susceptible, Infectious, and Recovered (SIR) COVID-19 individuals over time. The State model is developed in partnership with Presbyterian Health Services, Los Alamos National Laboratory, Sandia National Labs, and NMDOH. It incorporates a variety of data sources, including near real-time daily data feeds of:
- COVID-19 case information
- State-wide testing rates
- Geographic distribution of cases and testing
- Clinical outcomes including hospitalization, intensive care, and mechanical ventilation
- Resource capacity and demand
The NM model also considers differences in disease risk using comprehensive data on social determinants of health, the Johns Hopkins Adjusted Clinical Groups, health plan claims data, and delivery system clinical data.
To develop the State model, the NM team consults a variety of evidence-based research and sources. Some of these resources are provided below, and this list will be updated over time.
- Wallinga, J., & Teunis, P. (2004). Different epidemic curves for severe acute respiratory syndrome reveal similar impacts of control measures. American Journal of epidemiology, 160(6), 509-516.
- Briefing Note: Calculation of Effective Reproduction Number, R
- H Juliette Unwin, Swapnil Mishra, Valerie C Bradley et al. State-level tracking of COVID-19 in the United States (21-05-2020), doi: https://doi.org/10.25561/79231.
New Mexico Modeling Assumptions
To build out the model, NM modelers incorporated the following assumptions:
|
COVID-19 Epidemiology Modeling Assumptions *changes weekly based on new data and analysis |
|
| Assumption | Metric |
| R_Effective* (Mean number of secondary COVID-19 cases produced by one COVID-19 case) | 1.1 |
| Positive Test Multiplier* (number used to multiply current cases to estimate actual number of cases, as many people with COVID-19 have mild/no symptoms) | 2.1 |
| Case fatality rate* (proportion of persons with a particular condition who die from that condition. Denominator is number of persons with the condition; numerator is number of cause-specific deaths among those persons) | 2.1% |
| Length of hospitalization* |
Medical 5 days Intensive Care Unit (ICU) 14 days ICU on Ventilator: 14 days |
| Hospitalization rate* |
Medical (excluding ICU): 5.36% ICU: 2.79% Ventilation Rate: 34.0% of ICU |
| Population Size | 2,010,000 |
| Date of initial community spread | 3/13/20 |
| Schools Close | 3/13/20 |
| Reduced Public Gatherings | 3/15/20 |
| Shelter at home | 3/24/20 |
| Statewide mask mandate | 5/16/20 |
Disclaimer: Although every effort has been made to produce valid data, by using this data, User acknowledges that the State of NM, including the NMDOH, makes any warranty, express or implied, of either the accuracy or completeness of this information or assumes any liability or responsibility for the use of this information. Additionally, this information is provided solely for research purposes and is not provided for purposes of offering medical advice. Accordingly, the State of NM, including the NMDOH, is not to be liable to any user for any loss or damage, whether in contract, tort (including negligence), breach of statutory duty, or otherwise, even if foreseeable, arising under or in connection with use of or reliance on the content displayed on this site.
Copyright New Mexico Department of Health